Chapter 7: Displaying the pipeline visually with pipeline_printout_graph(...)
See also
Note
Remember to look at the example code:
Printing out a flowchart of our pipeline
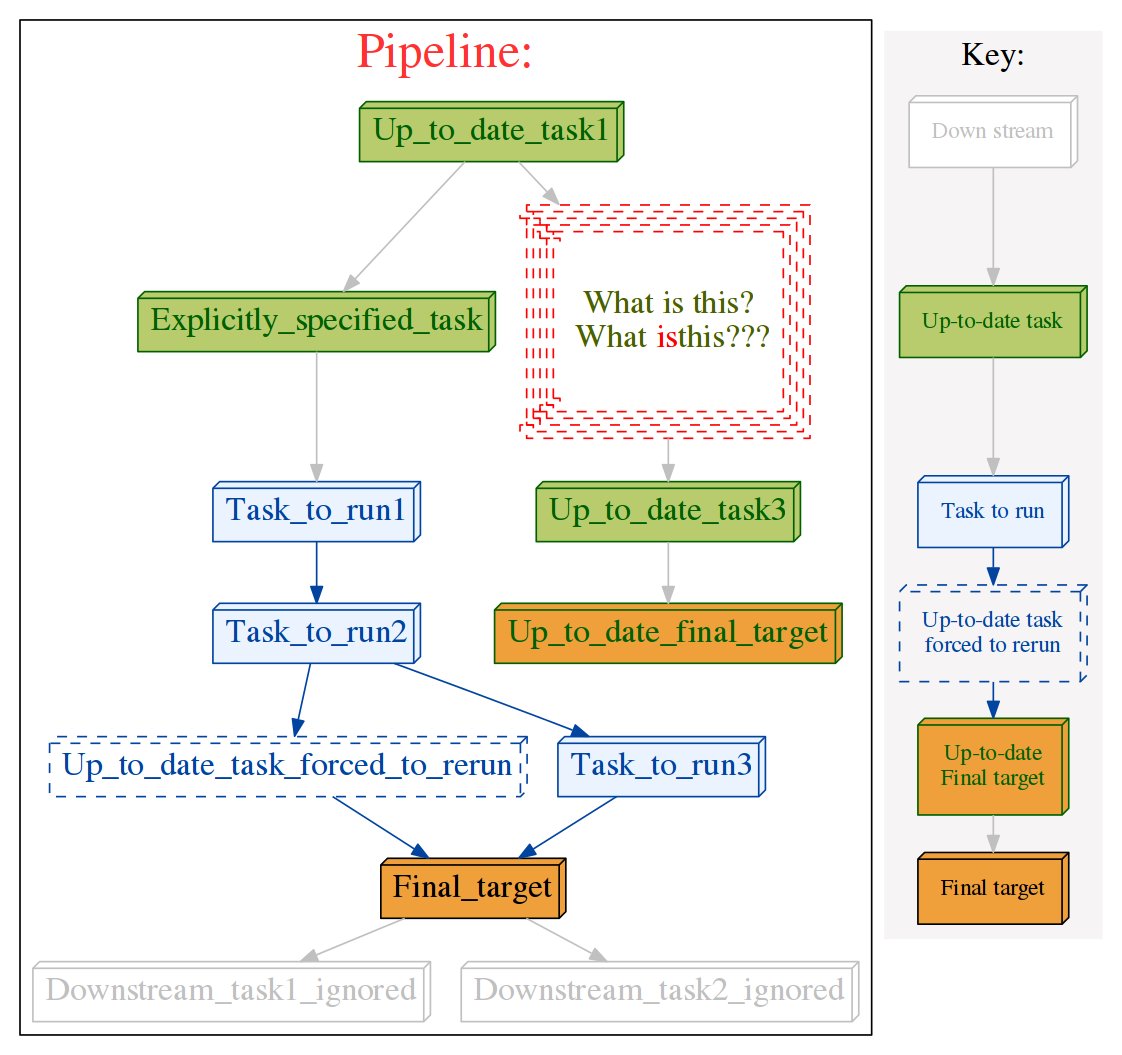
It is all very well being able to trace the data flow through the pipeline as text. Sometimes, however, we need a bit of eye-candy!
We can see a flowchart for our fledgling pipeline by executing:
pipeline_printout_graph (   'flowchart.svg',
                            'svg',
                            [second_task],
                            no_key_legend = False)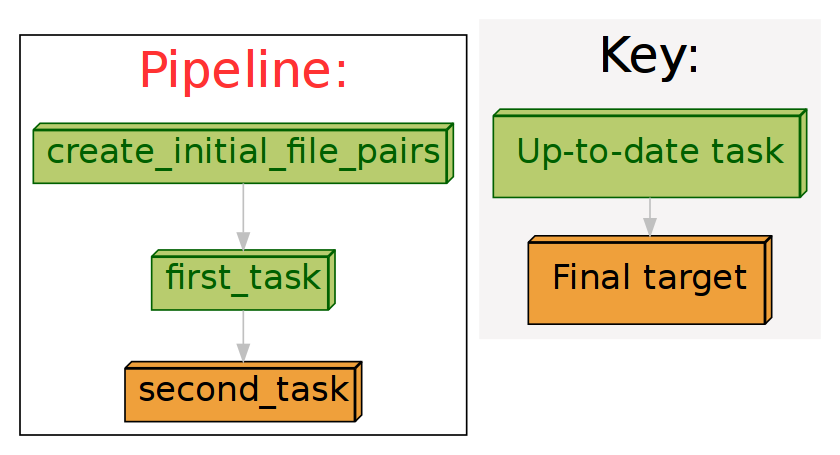
Flowcharts can be printed in a large number of formats including jpg, svg, png and pdf.
There are 8 standard colour schemes, but you can further customise all the colours to your satisfaction:
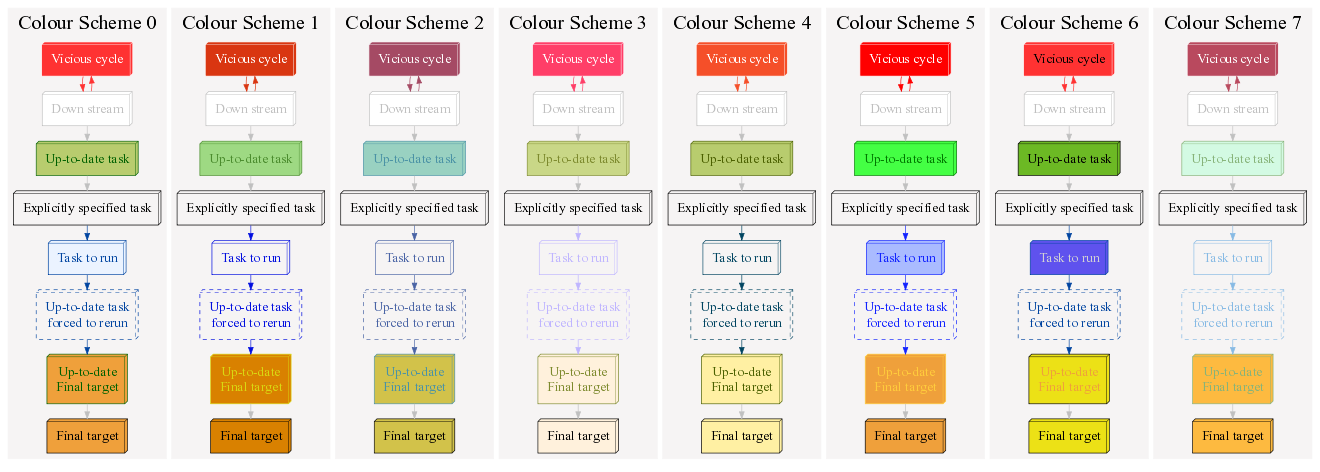
See here for example code.
Command line options made easier with ruffus.cmdline
If you are using ruffus.cmdline, then you can easily ask for a flowchart from the command line:
your_script.py --flowchart pipeline_flow_chart.pngThe output format is deduced from the extension but can be specified manually:
# specify format. Otherwise, deduced from the extension
your_script.py --flowchart pipeline_flow_chart.png --flowchart_format png
Print the flow chart horizontally or vertically...
# flowchart proceeds from left to right , rather than from  top to bottom
your_script.py --flowchart pipeline_flow_chart.png --draw_graph_horizontally
...with or without a key legend
# Draw key legend
your_script.py --flowchart pipeline_flow_chart.png --key_legend_in_graph
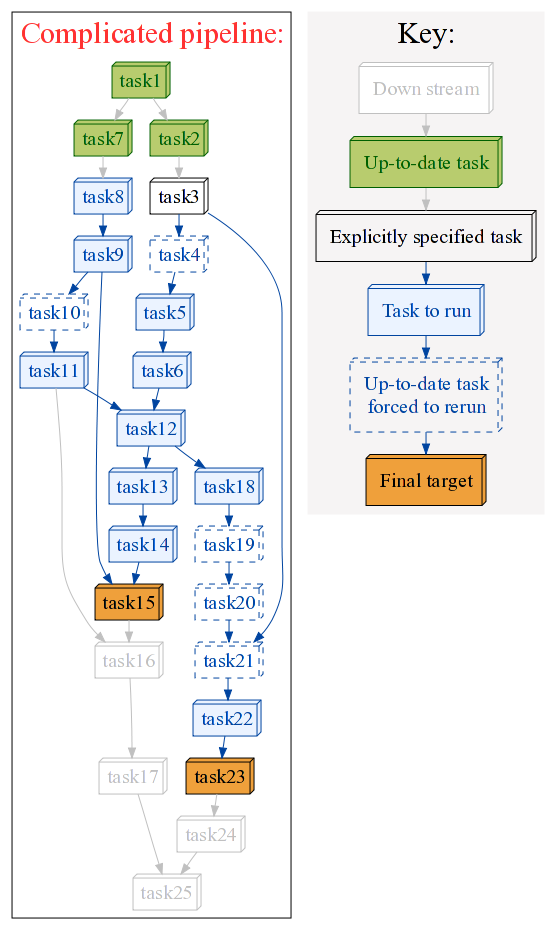
Horribly complicated pipelines!
Flowcharts are especially useful if you have really complicated pipelines, such as
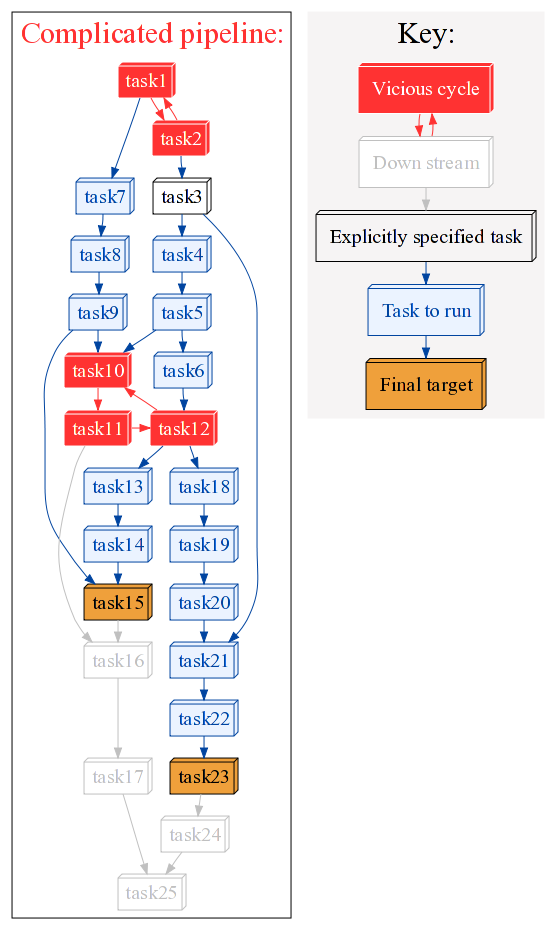
Circular dependency errors in pipelines!
Especially, if the pipeline is not set up properly, and vicious circular dependencies are present:
@graphviz: Customising the appearance of each task
The graphic for each task can be further customised as you please by adding graphviz attributes such as the URL, shape, colour directly to that node using the decorator `@graphviz.
For example, we can customise the graphic for myTask() to look like:
by adding the requisite attributes as follows:
@graphviz(URL='"http://cnn.com"', fillcolor = '"#FFCCCC"',
                color = '"#FF0000"', pencolor='"#FF0000"', fontcolor='"#4B6000"',
                label_suffix = "???", label_prefix = "What is this?<BR/> ",
                label = "<What <FONT COLOR=\"red\">is</FONT>this>",
                shape= "component", height = 1.5, peripheries = 5,
                style="dashed")
def Up_to_date_task2(infile, outfile):
    pass

#   Can use dictionary if you wish...
graphviz_params = {"URL":"http://cnn.com", "fontcolor": '"#FF00FF"'}
@graphviz(**graphviz_params)
def myTask(input,output):
    pass
You can even using HTML formatting in task names, including specifying line wraps (as in the above example), using the label parameter. However, HTML labels must be enclosed in < and >.
label = "<Line <BR/> wrapped task_name()>"Otherwise, you can also opt to keep the task name and wrap it with a prefix and suffix:
label_suffix = "??? ", label_prefix = ": What is this?"
- The URL attribute allows the generation of clickable svg, and also client / server
- side image maps usable in web pages. See Graphviz documentation